
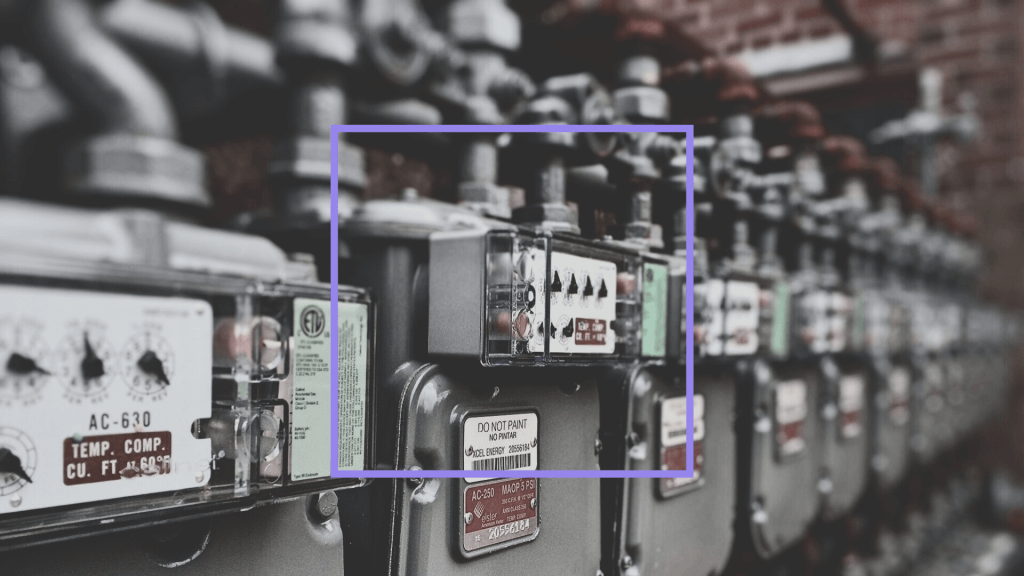
Smart Industry
Monitoring
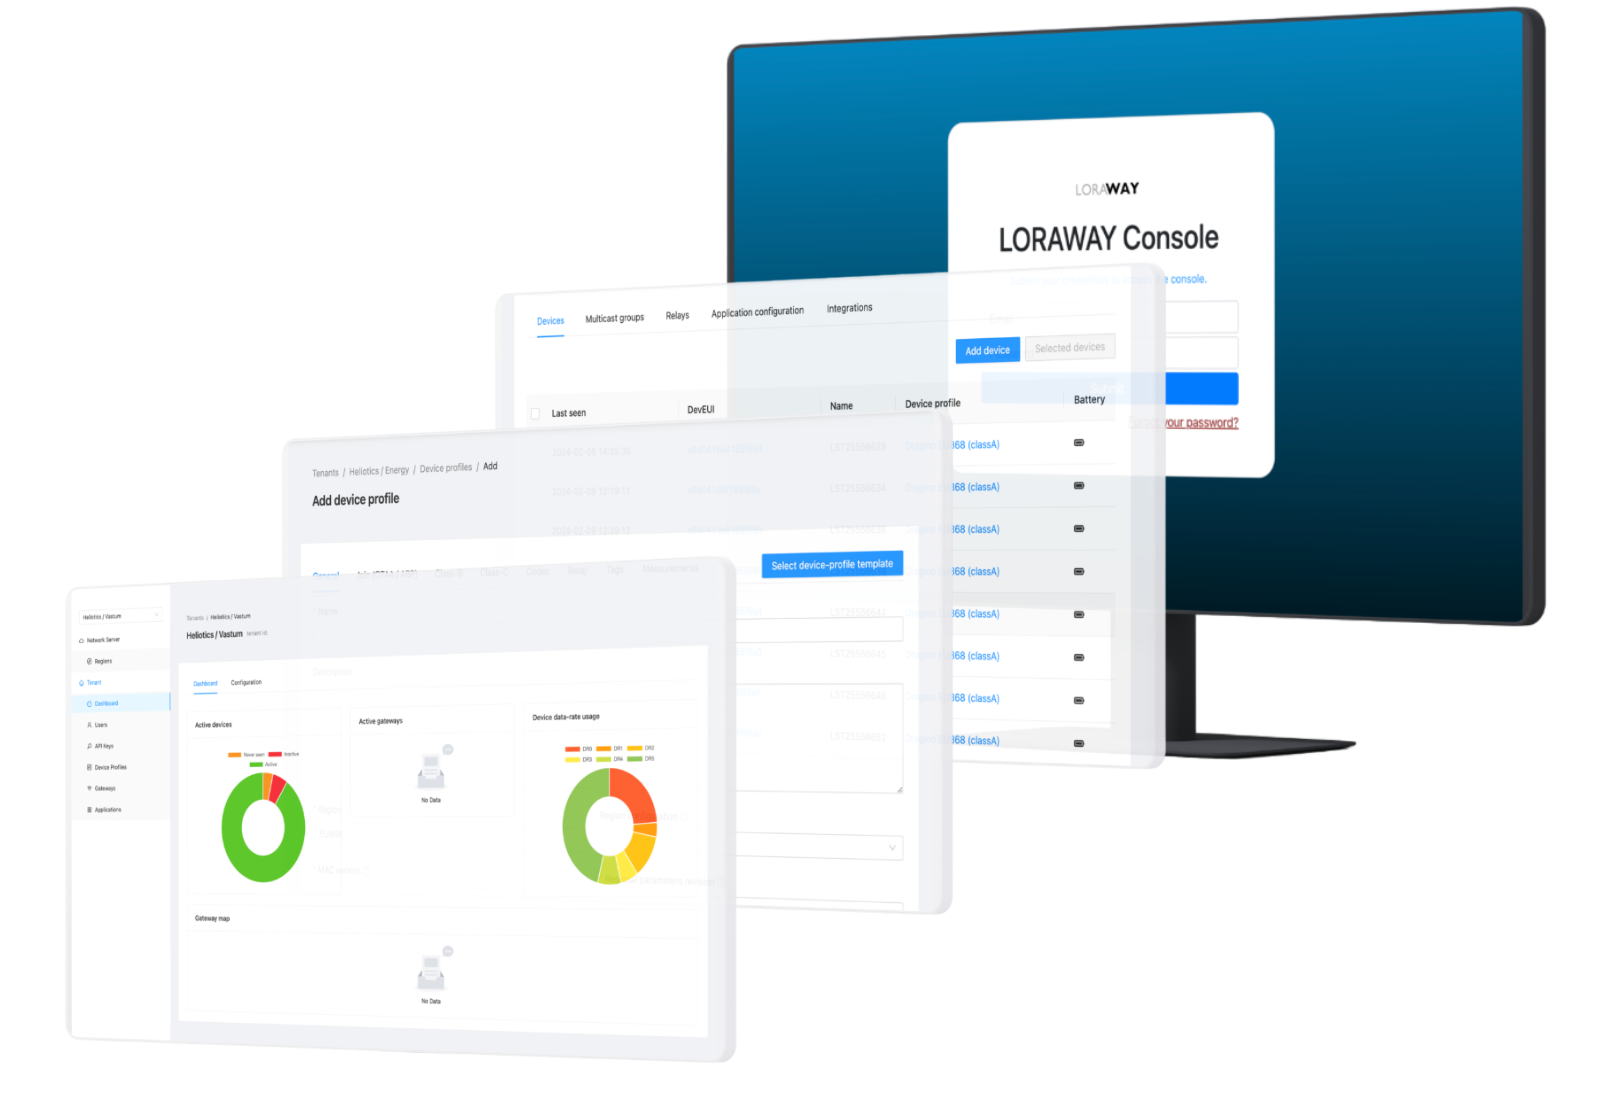
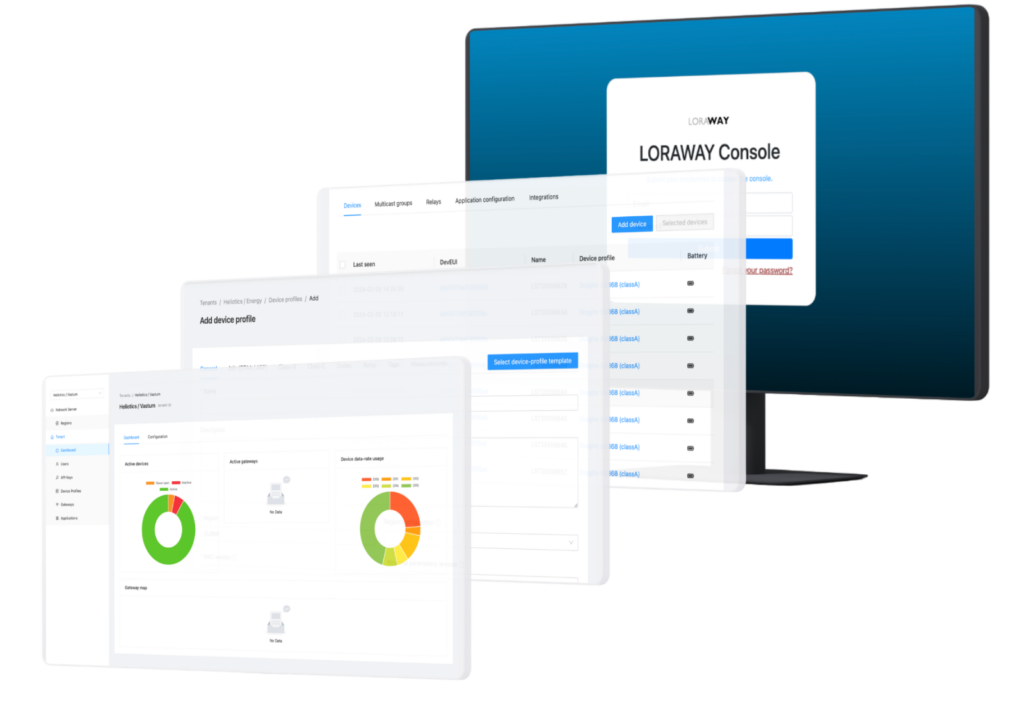
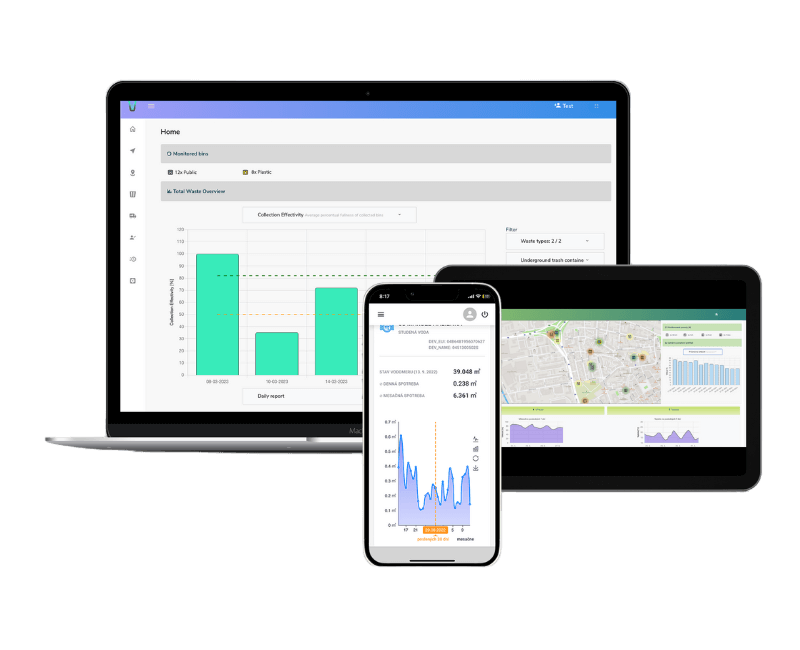
Heliotics CORE
Fully Modular and Scalable No-Code IoT Platform for Smart Monitoring of Industrial Facilities.
Smart
Industry
Monitoring

CONNECT
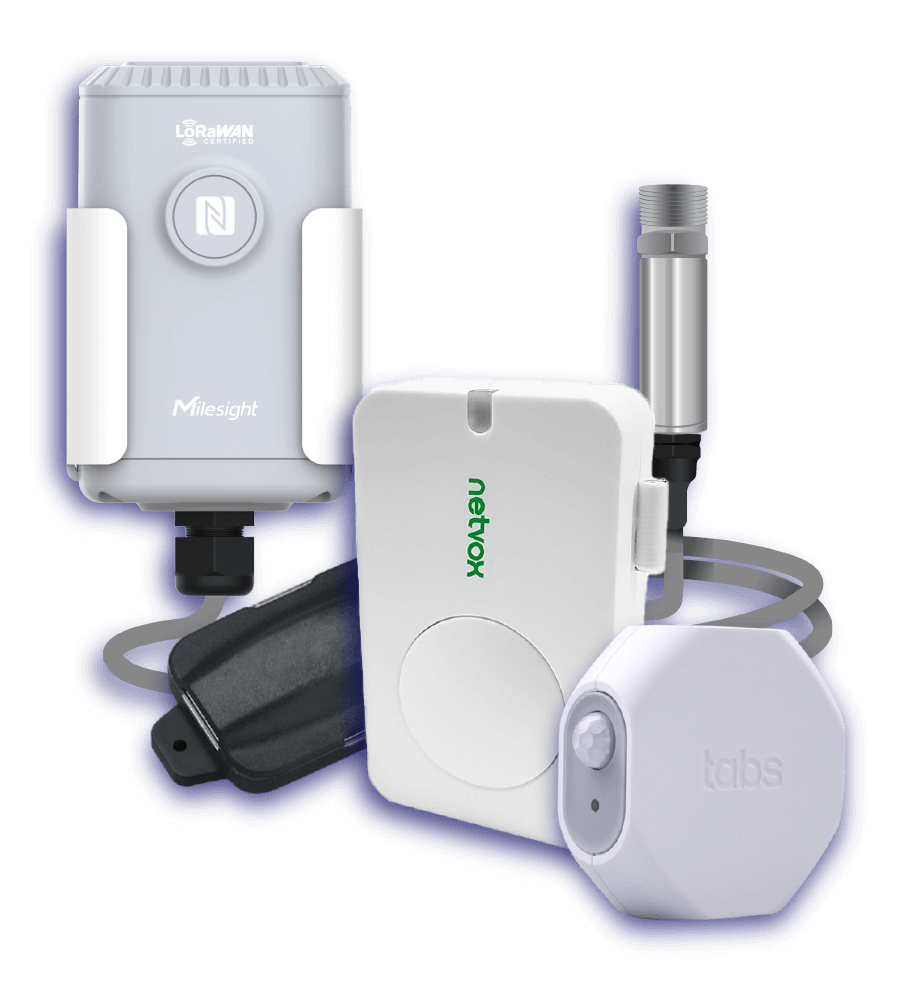
Any IoT sensor on any network
GET DATA
From any process, object or area
ANALYZE
Data to identify issues and inefficiencies
IMPROVE
To be efficient, cost-saving and have control
CONNECT
Any IoT sensor on any network
GET DATA
From any process, object or area
ANALYZE
Data to identify issues and inefficiencies
IMPROVE
To be efficient, cost-saving and have control


Dashboards and data exports
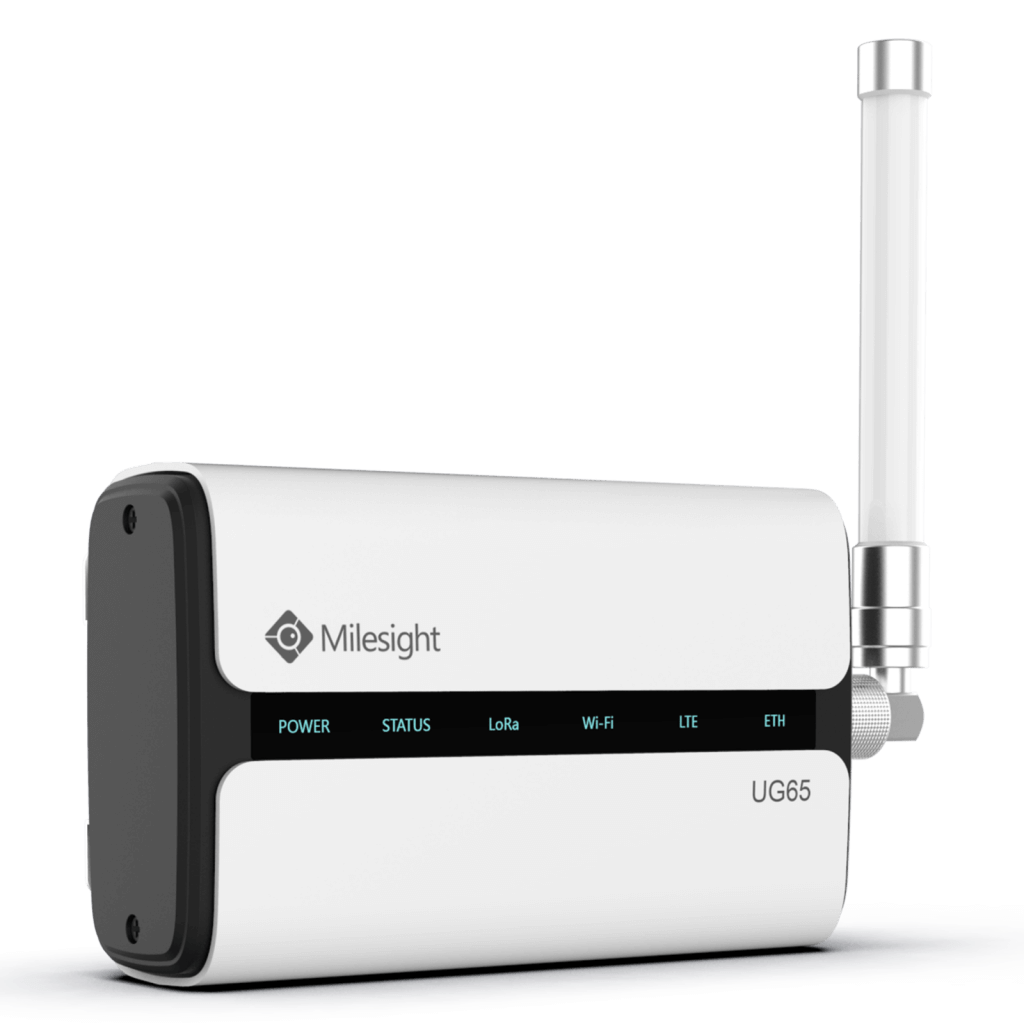
Multiple networks
Many supported devices
Real-time alerts
Customization and whitelabel
Easy onboarding
For all platforms
Integrate with API


 Helium